
IELTS Academic Writing Task 1 · Overview practice
Seeing the Main Pattern
Practise identifying and writing concise, accurate overviews for IELTS Academic Task 1 charts. An overview highlights the most important overall patterns or comparisons; the details that support them belong in the body.
3 drills · 11 scored questions · 1 ungraded writing task · about 25 minutes
0 / 11 answered
Drill A · Select the main picture
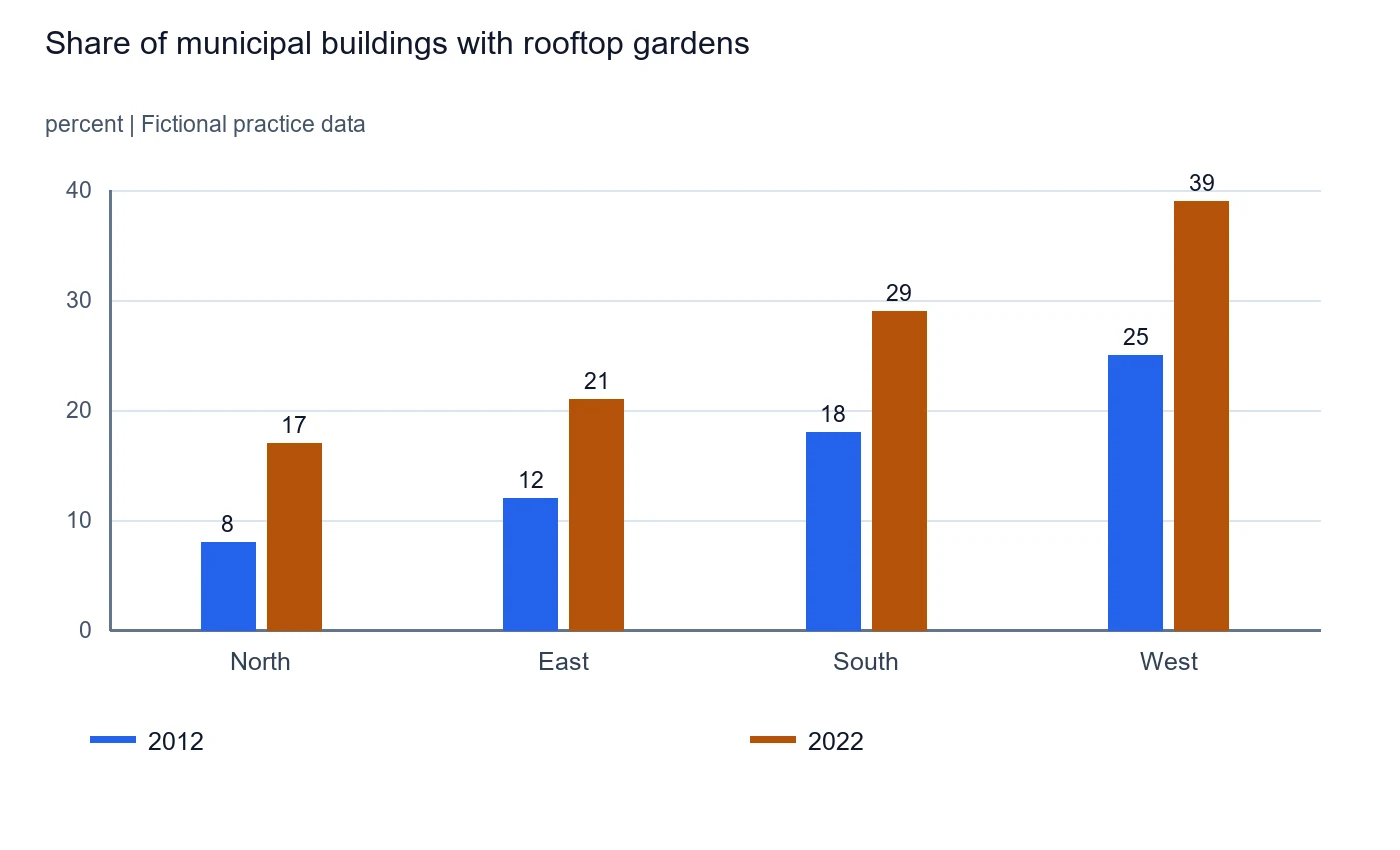
Which sentence gives the most suitable overview of the data?
Accessible chart data
| Series | 2012 | 2022 |
|---|---|---|
| North | 8 | 17 |
| East | 12 | 21 |
| South | 18 | 29 |
| West | 25 | 39 |
A: This reports two exact starting values. They are supporting details for a body paragraph rather than the main picture. B: Correct. Every district increased, and West remained highest at both endpoints. The sentence accurately summarizes a broad trend and a useful comparison without adding unsupported claims. C: This expresses a personal reaction and evaluates the decision. The dataset reports proportions and does not state why the figures changed. D: This is a true but narrow endpoint comparison. It leaves out the overall rise across all four districts and the ranking that remained consistent.
Drill B · Overview or supporting detail?
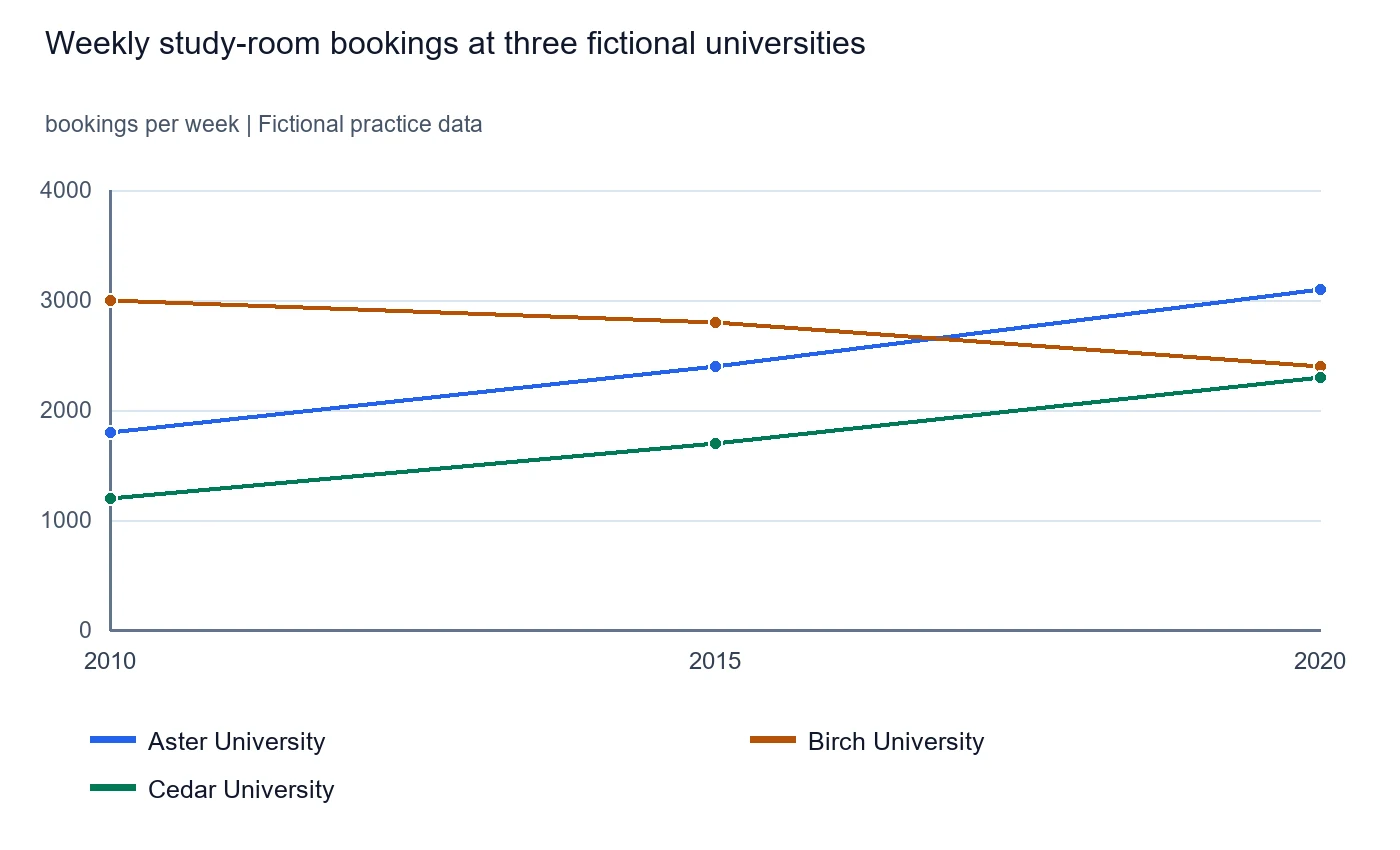
Classify each proposed overview for the study-room booking chart. Choose the category that best explains its main issue, if any.
Categories: Good overview / Too much numerical detail / Inappropriate register.
Accessible chart data
| Series | 2010 | 2015 | 2020 |
|---|---|---|---|
| Aster University | 1800 | 2400 | 3100 |
| Birch University | 3000 | 2800 | 2400 |
| Cedar University | 1200 | 1700 | 2300 |
2. Overall, bookings increased at Aster and Cedar, whereas they declined at Birch, which had the highest level at the beginning.
This accurately summarizes the opposing directions and the starting leader without listing individual values.
3. Aster recorded 1,800 bookings per week at the start and 3,100 at the end, while Birch went from 3,000 to 2,400.
The exact values and years describe specific points. The sentence would work better as body support after a broad overview.
4. Overall, bookings rose at Aster and Cedar but fell at Birch, and Aster replaced Birch as the busiest university.
The two rising series contrast with the declining one. Aster overtakes the initial leader, Birch, by the final year.
5. Aster recorded 1,800, 2,400 and 3,100 weekly bookings at the three points, while Cedar recorded 1,200, 1,700 and 2,300.
The sentence lists six observations. Those values belong in the body, while the overview should describe the general rise and relevant contrast.
6. What a brilliant result for Aster and Cedar; Birch really needs to catch up!
“Brilliant” and “needs to catch up” are evaluative and conversational. The chart gives no basis for judging the universities.
7. Let's take a look: Aster and Cedar went up, Birch went down, and Aster took the lead.
The trend statements and change of leader are accurate, but 'Let's take a look' addresses an audience in a conversational way. Use neutral report language. No numerical-detail issue is present.
Drill C · Build an accurate overview
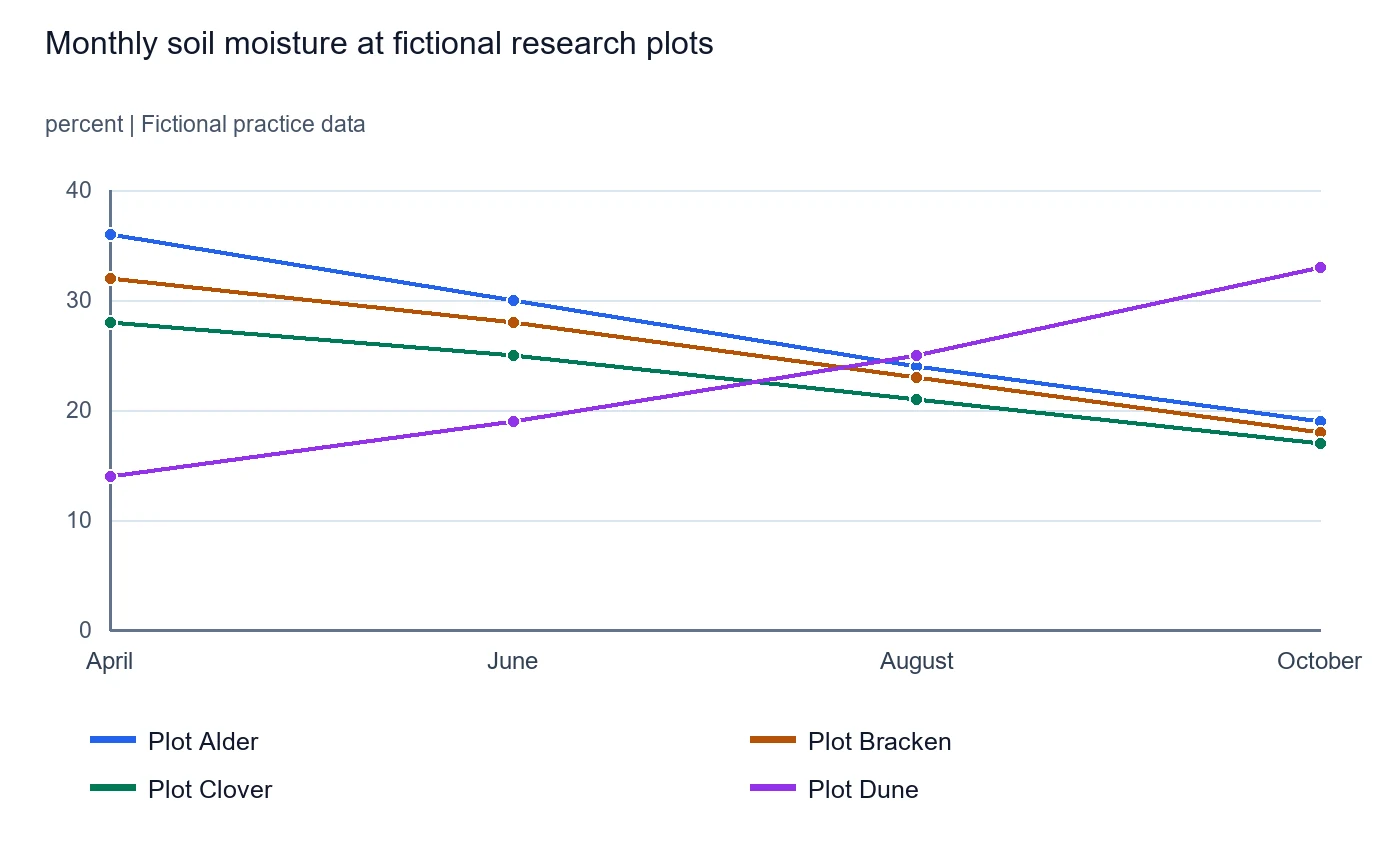
Complete the overview with one word in each gap. The sentence summarizes the three declining plots and the plot that moved in the opposite direction.
Use a signpost, a past downward verb, a contrast connector and a past upward verb. More than one suitable answer is accepted.
Accessible chart data
| Series | April | June | August | October |
|---|---|---|---|---|
| Plot Alder | 36 | 30 | 24 | 19 |
| Plot Bracken | 32 | 28 | 23 | 18 |
| Plot Clover | 28 | 25 | 21 | 17 |
| Plot Dune | 14 | 19 | 25 | 33 |
, soil moisture at the three woodland plots over the season, the level at Plot Dune .
A concise signpost introduces the summary. Other valid signposts may exist in free writing, but these fit the one-word gap.
Accepted answers: Overall, Generally.
All three woodland plots show lower soil moisture by October than in April.
Accepted answers: fell, declined, decreased, dropped.
Whereas and while explicitly contrast the directions. But also expresses contrast; although makes a grammatical concessive comparison in this sentence.
Accepted answers: whereas, while, but, although.
Plot Dune rises at each recorded point, so a positive trend verb accurately describes it.
Accepted answers: rose, increased, climbed, grew.
Write your own overview
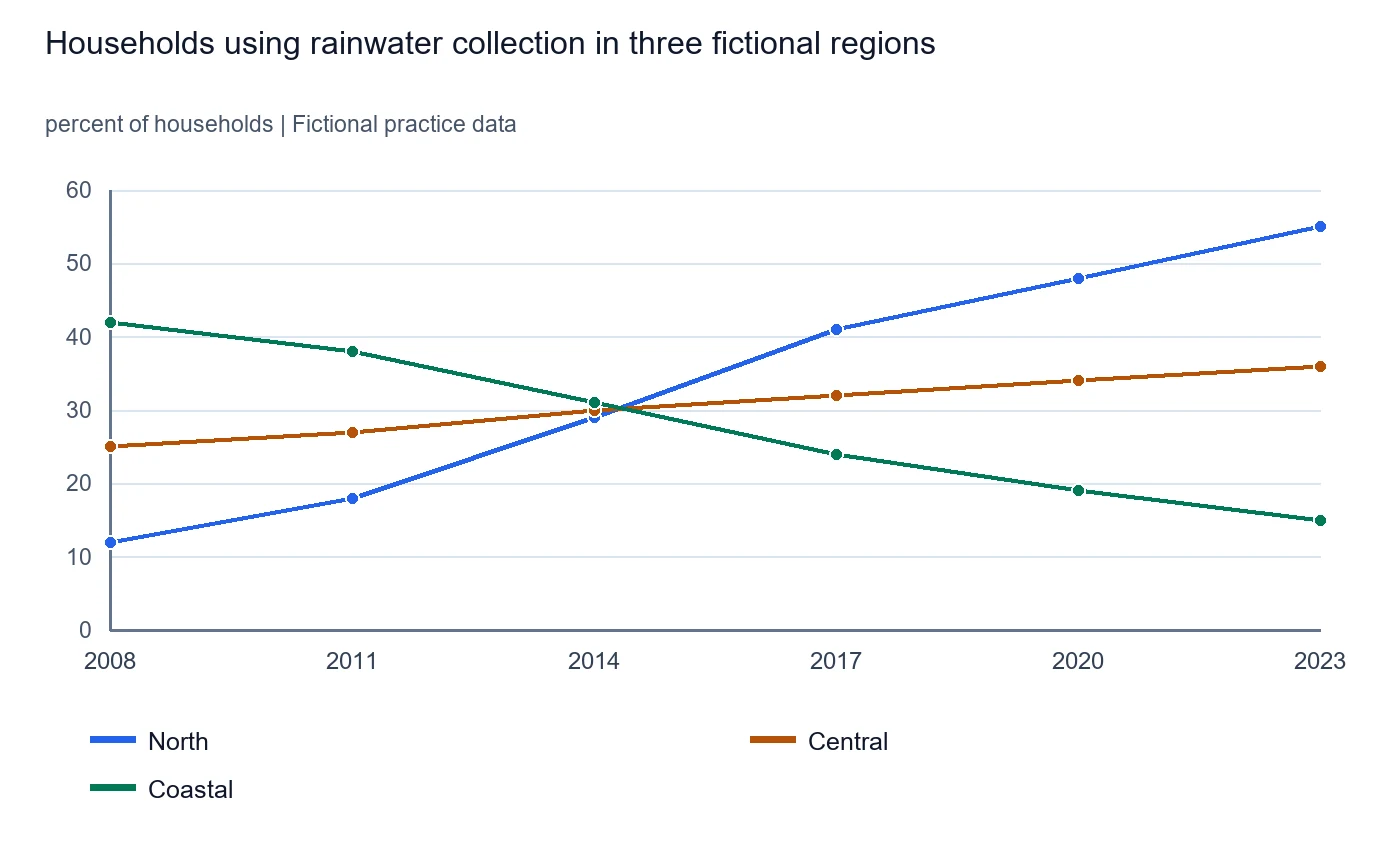
Study the fictional chart data and write an overview of the main patterns. You may use one or more sentences as needed. Focus on the most important trends and comparisons; avoid turning the overview into a list of every value. No fixed sentence count or word count is required.
This response is ungraded. The 11-question score is a drill score and does not estimate an IELTS band.
Accessible chart data
| Series | 2008 | 2011 | 2014 | 2017 | 2020 | 2023 |
|---|---|---|---|---|---|---|
| North | 12 | 18 | 29 | 41 | 48 | 55 |
| Central | 25 | 27 | 30 | 32 | 34 | 36 |
| Coastal | 42 | 38 | 31 | 24 | 19 | 15 |
0 words
One possible overview
Overall, household use of rainwater collection rose markedly in North and more gradually in Central, while it declined steadily in Coastal. North moved from the lowest starting proportion to the highest by the end, as Coastal shifted from first to last.
The overview captures the dominant directions: North and Central rose, while Coastal fell.
It highlights the major ranking reversal between North and Coastal, which helps distinguish the series.
It avoids listing every plotted value and does not add a cause that the chart cannot show.
Past tense suits the completed years shown. Other accurate phrasing and sentence structures can also work.
Review your writing
Submit to grade the 11 drill questions. Use Show answer to study any item.
A practical approach to an overview
Choose the main picture
Look across the whole visual before selecting details. For a time series, consider the broad direction of each series, which changed most, and any important convergence or reversal. For a comparison chart, consider the largest contrasts or the overall ranking.
Select only the features that matter most
Include the key pattern and, where useful, a comparison that helps the reader understand it. A clear overview may be one sentence or more than one; the right length depends on how much important information the visual contains.
Keep claims faithful to the visual
Describe patterns the visual supports. In these drills, practise expressing the main picture without exact figures; reserve supporting values for the body. This practice focus is not a universal ban on every number in every overview. Never invent causes or forecasts.
Use an appropriate reporting style
A signpost such as “Overall,” can make the overview easy to locate, though no particular opening phrase is compulsory. Use neutral, precise language. Choose tense and time expressions to match the dates and information shown; past dates often call for past forms, while undated processes may call for present forms.
Keep the overview distinct from the body
The overview states the main picture. Group similar series where appropriate, cover important exceptions, and use selected figures in the body to develop the comparisons. An overview is not a point-by-point inventory.
These are practice strategies, not a guaranteed band formula. Assessment depends on the complete response and the applicable IELTS criteria.
For assessment context: IELTS Academic Writing test format, IELTS Writing Band Descriptors (May 2023). All exercise data and examples on this page are invented for this practice.